Final Google Analytics Report Analysis
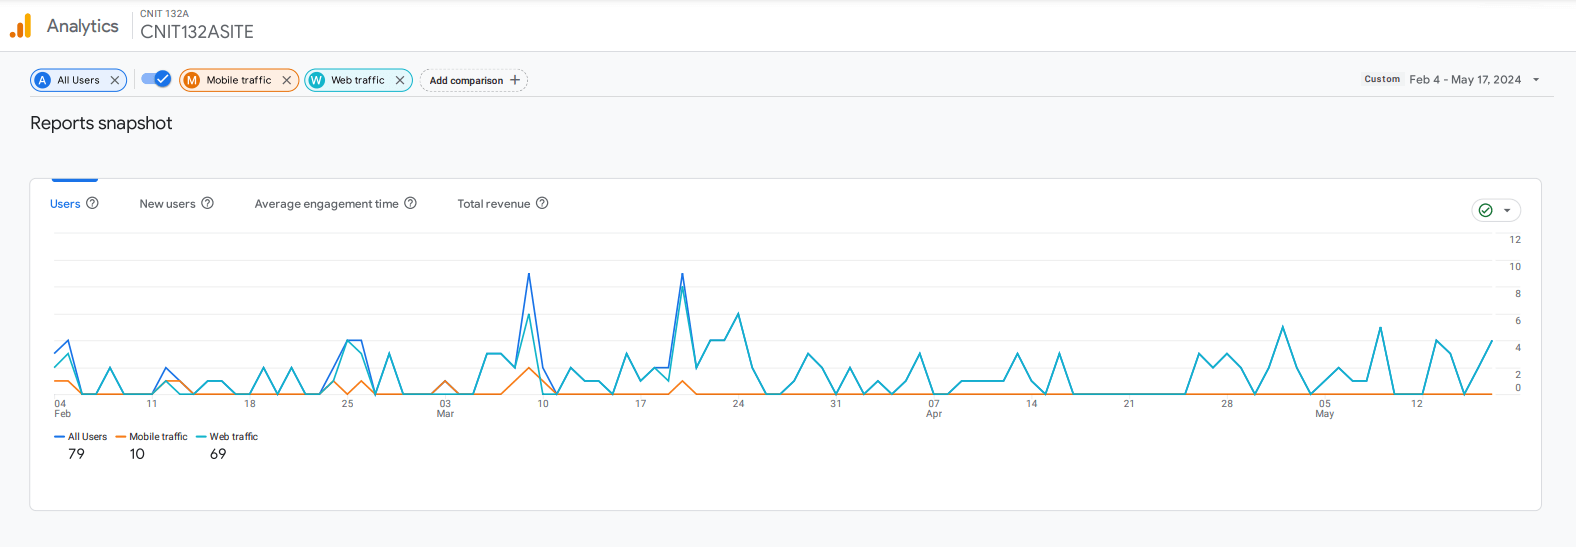
The image above shows part of the Google Analytics report in pdf generated by Google Analytics 4, analyzing the following insights for the period between February 4 and May 17, 2024:
User Engagement:
- A total of 79 users visited the website, with 69 accessing it via web and 10 through mobile.
- The United States is the primary source of traffic, with 66 users, followed by the United Kingdom (4 users), Germany (3 users), and China and Vietnam (2 users each).
- User activity peaked around March 1st and gradually declined towards May.
- The most viewed pages include "Jocelyne Alcantara"(the landing page), "Flying Plane", "CSS Shapes", and others related to web development topics.
- Top events indicate significant user engagement, with page views (876), user engagement (660), and scrolls (544) being the most frequent.
Where do my new users come from?
- Most new users come directly to the website, followed by organic search and referrals.
- Direct traffic also dominates sessions, with a few sessions originating from referrals and organic search.
Overall, the website attracts a moderate amount of traffic, primarily from the US. While initial user engagement seems promising, the declining retention rate indicates a need for further analysis and potential improvements to the website's content or user experience to encourage repeat visits.